Bamboo: Open Source Data Analysis for the Web
At the Sustainable Engineering Lab (SEL), we work with governments and International development organizations to create smarter development processes, often using data. When necessary, we create open source software to enable our work, and share it with a wider community. Formhub is a very successful example of this—it was created to help our partners launch and manage mobile data collection efforts more easily, and has now helped thousands of users collect data using Android smartphones. In this post, I want to talk about a tool that solves another data problem: Bamboo.
Our experience has led to the unsurprising conclusion that raw data is unhelpful to those in the front lines of development. We’ve learned that to help users, we need easy ways to transform and aggregate data, with statistics and formulas helping sift through what can become unwieldy spreadsheets. An education planner can use a “percentage of untrained teachers in an administrative area” much more effectively than using a raw data file including multitudes of data about hundreds of schools. Such “indicators” become the basis of better understanding and decision-making. We built Bamboo to encapsulate the process of creating indicators and calculating their values as soon as data is collected, to be queried on demand.
Bamboo
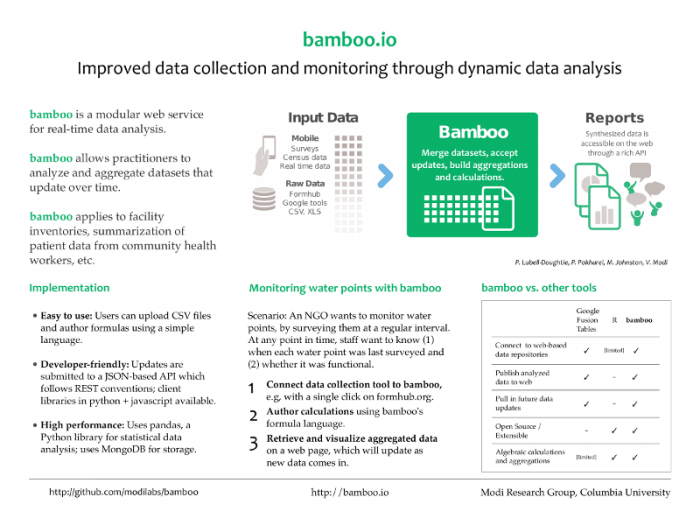
Bamboo, in essence, is a streaming calculations service. To use it, you “connect” an ongoing survey in a tool like Formhub. Next, you write “calculations” and register them with your dataset. Finally, you get a URL from Bamboo; anytime you get data from this URL, you get the most recent dataset with all of its calculations already pre-processed. That is, you write indicators once, and as data streams in, Bamboo makes the calculations, and provides a processed dataset for you.
In Bamboo, datasets are dynamic. Each dataset is associated with an API which allows you to further update that data. You can upload a CSV file to form the base of a dataset, or “connect” a survey from a data collection service that can communicate to Bamboo. Bamboo uses an open CRUD API that any data collection service can connect to; Formhub and Ona both provide single-button connections.
Once you have a dataset, you create calculations using an easy-to-learn formula language, and register them to your dataset. Let’s say that we connected a survey of schools in states of a certain country, and have a second uploaded dataset about the population of various states in the country. Calculations in Bamboo can be:
- column-wise (eg. the ratio of female to male students per school)
- aggregate calculations (eg. total number of students in the state)
- column-wise joins (eg. a merged dataset, which contains total number of students in the state and population)
- row-wise concatenations (eg. two school surveys combined together)
Many calculations in fact create linked data sets; when data is updated or deleted in an “upstream” dataset, these changes are propagated “downstream” to all dynamically created datasets. For example, if a new school is surveyed, the total number of students in state would update in the school dataset first, then the state-dataset, and finally in the state-level dataset that combines number of students and population into the same dataset.
Processed data is available via many formats, both machine- and human-friendly. For example, users can download a CSV file to open in Excel, or a visualization can access the dataset using a JSON API.
Bamboo uses MongoDB as a datastore, and does its calculations in-memory, using the pandas library. It has been designed for human-collected datasets, which can be very “wide” (i.e. have many columns) and tend not to be very “long” (i.e., generally under 100,000 rows). It has also been described in a paper that was presented at ACM DEV 2013.
The Future of Bamboo — in Your Hands!
Bamboo implements the above-outlined functionality. Its versatility has led to usage in projects as diverse as Soil Monitoring and Patient Tracking. Bamboo has an impressive feature set that can help many different data-based projects in development dealing with human-collected data. However, there are a few challenges left, particularly around creating UIs to make indicator authoring accessible to non-technical audiences, and ensuring sufficient scalability. And unfortunately, the projects that have funded the development of Bamboo within the Lab have shifted in direction.
Bamboo is open source software, and the purpose of this post is to encourage others to pick bamboo up where we have left it and continue to develop it. There has been recent interest in a Hacker News thread, and we sincerely believe that bamboo hits the sweet spot in many data-based projects in the real world. Teams that need to deal with the use case of live indicator creation that we outlined earlier may find it just the tool to continue developing.
We have a version of bamboo up on http://bamboo.io, which is for TESTING ONLY. There are no guarantees of data storage on this server. We hope in the coming year that many teams host their own versions with production data on them!