Finding and Connecting People to Infrastructure using Satellite Imagery and Mathematical Modeling
Success in an infrastructure project depends as much on local support and participation as it does on coordination between politicians, financiers and utilities (Tufte and Mefalopulos 2009). We wanted to create a freely accessible tool for non-technical people to experience the infrastructure planning process and see the impact of different decisions on the community. By experimenting first-hand with web-based software, a user can understand on a map how changes in population, pricing and fiscal policy influence where infrastructure is built, who will get access and why different technologies such as off-grid solar, mini-grid diesel or bio-diesel and grid affect cost.
Our lab combined technical expertise from remote sensing, operations research and electrical engineering into an easy-to-use system so that local leaders, politicians, financiers and utility owners can focus on communicating visually and negotiating between different electrification scenarios.
- Local leaders: Will the construction affect my community?
- Politicians: How many businesses and households in my district will get access?
- Financiers: What are the risk and return on investment?
- Utility owners: Is it technically and financially feasible?
Where do people live?
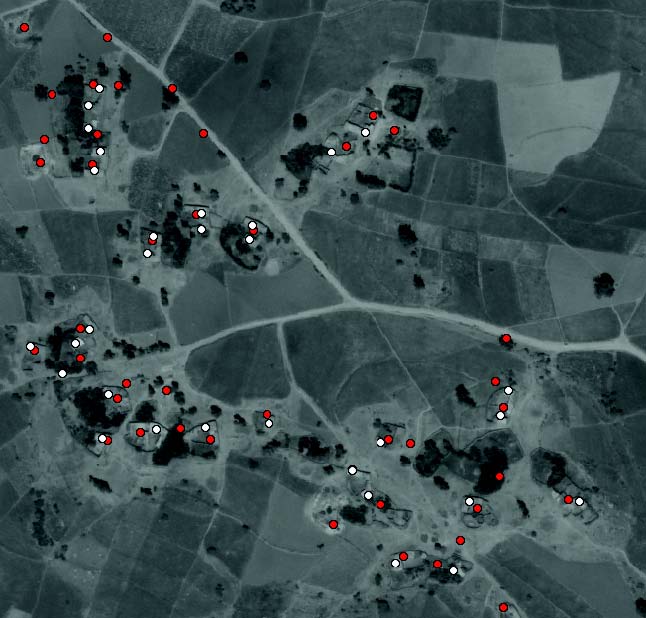
The remote sensing component finds where people live using image recognition on satellite imagery.
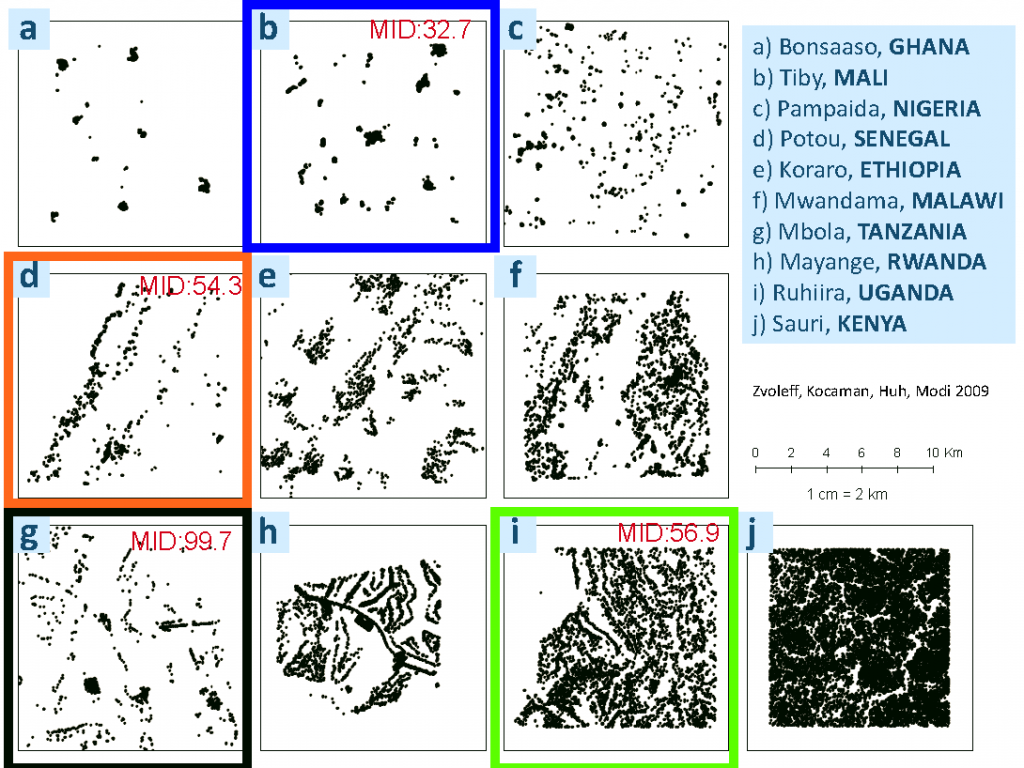
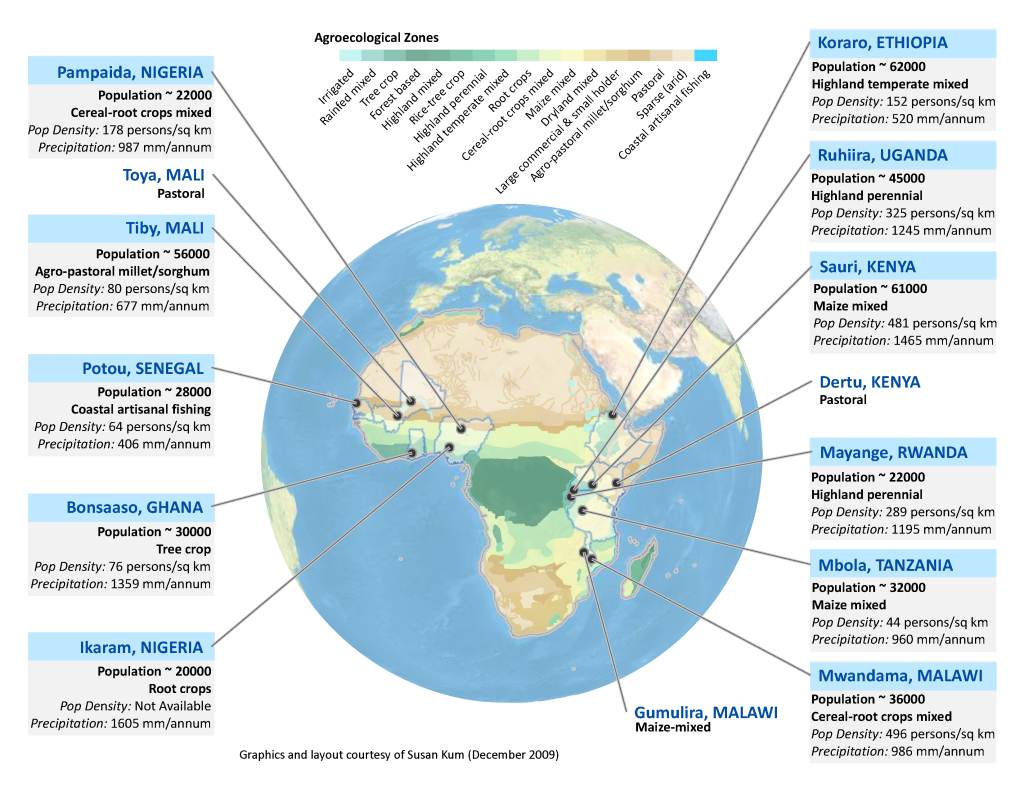
Results from the remote sensing component provide a spatial census, enabling us to estimate population density and spread with reasonable accuracy. Different settlement patterns hint at different electrification strategies: sparsely distributed clusters as in Ghana or Mali are good candidates for off-grid technologies such as solar, while larger clusters as in Tanzania justify diesel mini-grids and densely packed Kenya find grid electrification to be cost-effective (Zvoleff, Kocaman, Huh, Modi 2009). 
The command-line software to perform remote sensing was completed in 2008. We are in the process of optimizing the software to run on graphical processing units (GPUs) to make the system accessible via web.
How can we provide access to electricity?
The econometric and operations research component uses demographics and pricing models to project electricity demand, cost and placement (Parshall, Pillai, Mohan, Sanoh, Modi 2009). Users can freely explore what-if scenarios by changing the many parameters and see on a map what technology makes sense for each community, where and how much it will cost.
We have created a web-based prototype of the infrastructure planning component that is being used this semester by students of the Master’s in Development Practice program at Columbia University. We are currently improving the map-based user interface and you will be able to use it through your browser soon. [2013 update: Network Planner is live and functioning in browsers.]
The power of open source software
Both systems are built entirely using open source components such as
Python, GDAL, GEOS, Lush, OpenLayers and AMQP.
References
Alex Zvoleff, Ayse Selin Kocaman, Tim Huh, Vijay Modi. (2009) “The impact of geography on energy infrastructure cost.” Energy Policy, 37, 4066-4078. [link]
Lily Parshall, Dana Pillai, Shashank Mohan, Aly Sanoh, Vijay Modi (2009) “National electricity planning in settings with low pre-existing grid coverage: development of a spatial model and case study of Kenya.” Energy Policy, 37, 2395-2410. [link]
Pedro Sanchez et al. (2007) “The African Millennium Villages.” Proceedings of the National Academy of Sciences 104 (43). [link]
Thomas Tufte, Paolo Mefalopulos (2009) Participatory communication – a practical guide. World Bank Working Paper. [link]
Talks
How Python is guiding infrastructure construction in Africa PyCon Atlanta February 20, 2010 [video]
The impact of geography on energy infrastructure cost Millennium Villages Student Research Showcase February 18, 2009 [video]
Automatically finding houses in rural satellite images with multiband convolutional neural networks Millennium Villages Student Research Showcase February 18, 2009 [video]
Finding and connecting people in Africa to infrastructure using remote sensing and geospatial optimization O’Reilly Where 2.0 Conference March 31, 2010
Credits
| Principal Investigator | Vijay Modi |
| Project Manager | J. Edwin Adkins |
| Econometric Analysts | Aly Sanoh, Sahil Shah |
| Operations Research Analyst | Ayse Selin Kocaman |
| GIS Specialist | Susan Kum, Shaky Sherpa |
| Lead Software Engineer | Roy Hyunjin Han |
| Software Engineers | Po-Han Freeza Huang, Andrew Doro |
| Image Recognition Consultants | Yann LeCun, Marc’Aurelio Ranzato, Peter N. Belhumeur |
| Statistician | Jiehua Chen |
| Early Contributors | Arnaud Algrin, Lily Parshall, Dana Pillai, Shashank Mohan, Alex Hofmann, Alex Zvoleff, Matt Berg |
| Educational Consultants | Rob Garfield, Anders Pearson, Ethan Jucovy, Zarina Mustapha |
| Organizations | Gates Foundation, World Bank, UNDP |


